ANALYSING DATA MORE RIGOROUSLY
Advice on analysing data follows the guidance provided in Chapters 7 to 12 of the Handbook. The aim is to up-skill school leaders in the use of statistics through the use of real data and worked example's using R-coding. The development of leaders understand and use of the main techniques used to analyse data are best presented a series of six modules as set out below.
A Six-Step Approach to Answering Questions
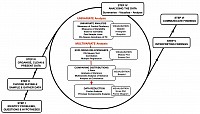
The first module, mirrored in Chapter 7, draws together elements of data storytelling and a step-by-step approach to analysing data that begins with the crucial aspect of asking the right questions. The types of questions are categorised into those requiring: a univariate analysis; exploration of relationships; comparison between distributions and data reduction. An aide-memoire is provided to outline the types of statistical tests required to answer questions typical questions asked by and of school leaders in each category. sample dataset is introduced, which is used in later modules to provide model solutions and worked examples that employ extracts of R-code provided to assist those new to this approach. An introduction to the use of the statistical package R is provided.
Visualising Data & Conducting Univariate Tests
This module develops the use of R by explaining how to explore data using descriptive statistics, visualisations and tables. In introduction to inferential statistics includes explanations of how to us use the following univariate tests: chi-square test of independence; one-way t-tests; the one-sample Wilcoxon Signed Rank test and the one-sample sign test.
Exploring Relationships: Chi-Square, Correlation & Regression
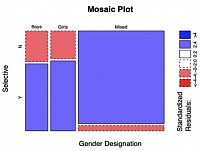
This module explains how to use chi-square tests, correlation analysis and multiple regression to explore relay between variables. A wide range of questions can be explained using these techniques, such as: Do attendance rates affect attainment? How well are our SEND students performing? and What are the main predictors of student progress in the classroom?
Identifying Strengths & Weaknesses: Factor Analysis
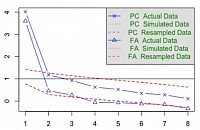
A detailed step-by-step explanation of how to use Factor Analysis to determine the underlying structure within large datasets is explained by the use of worked examples. This technique is useful in identifying strengths and weaknesses in school provision using data gathered from stakeholder questionnaires, observations or student performance data.
Comparing Two or More Measures : T-Tests and ANOVA
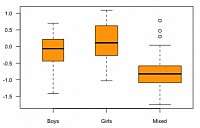
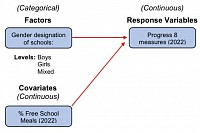
Detailed guidance is provided on using t-tests, Analysis of Variance (ANOVA), MANOVA, and ANCOVA to explore differences between distributions. Worked examples, R-code and appropriate visualisations are provided to help the reader understand the underlying principles of using these statistical tests.
Analysing Qualitative Data
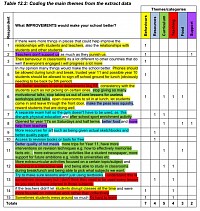
This module provides guidance on how to conduct a thematic analysis of qualitative data gathered via open-ended questions on the stakeholder questionnaire, lesson observation notes, or transcripts of focus group or individual interviews. Advice is provided on how to interpret, contextualise and triangulate the findings from quantitative analyses.
Or we can Analyse Data for you…
We can be commisioned to gather, analyse and interpret large data sets from within the education sector, and other contexts, using a wide range of multivariate statistical tests. We always adhere to the BERA guidelines.
